Hi Management
Analytics

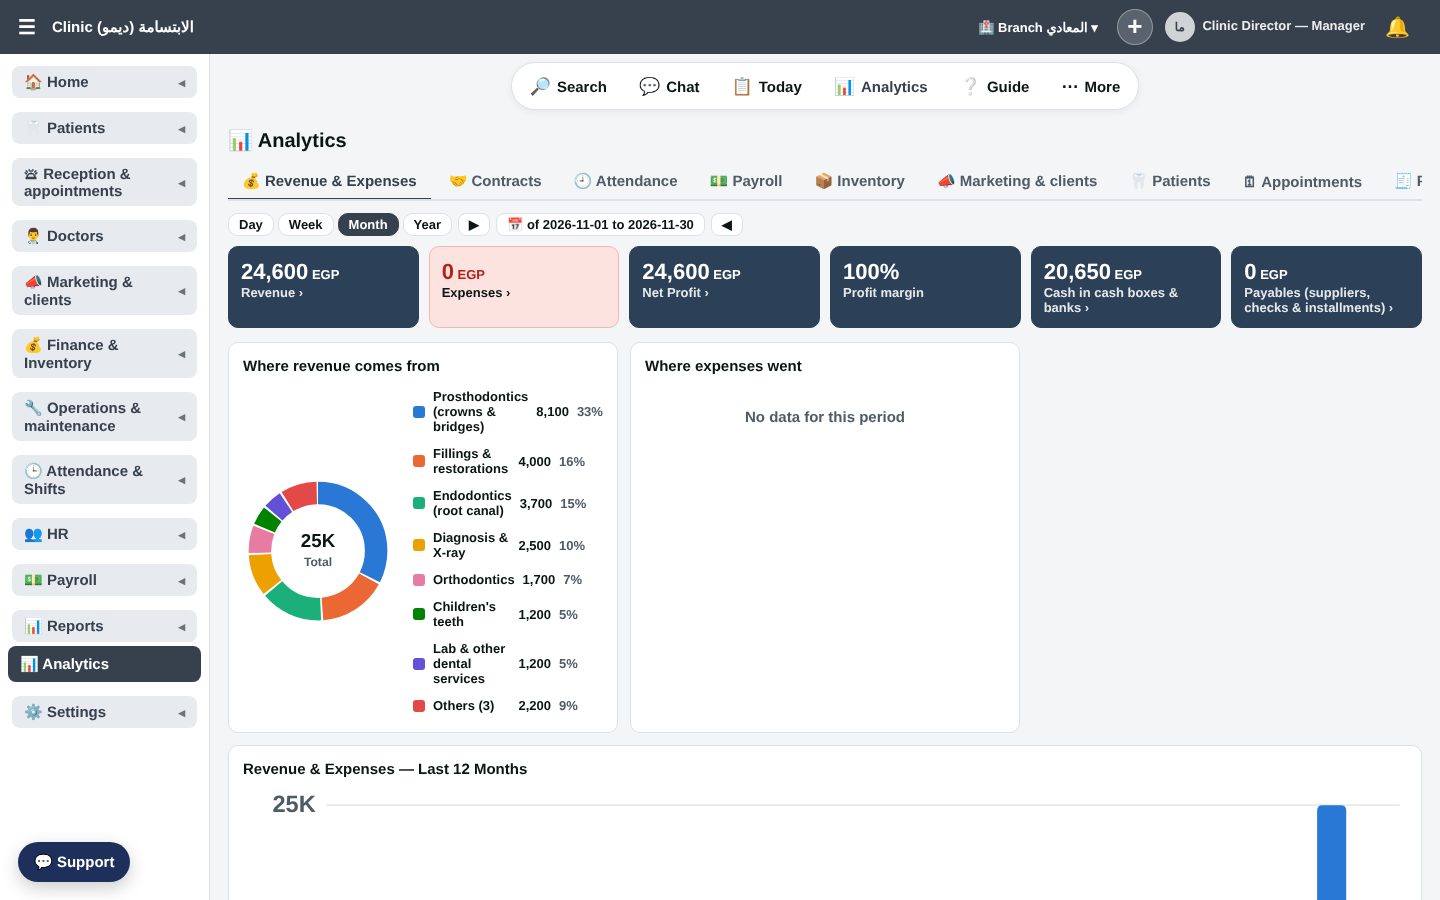
Real-time reports and analytics

Click any number to open its details.

The real analytics screen from a demo clinic
Pick the periodDay, week, month, year or a custom range.
Click any numberOpens the exact list behind it.
Per branch and specialtySee the whole clinic, one branch or one specialty.
Hide amountsShow the screen to your team without the money figures.

Patients

Sample figures from a demo clinic
New patients124+12%
Returning386+4%
With balance due47-6%
New patients per month
86
Jun
92
Jul
105
Aug
98
Sep
117
Oct
124
Nov
Patient source
100%
  • Facebook38%
  • Patient referral27%
  • Google18%
  • Instagram11%
  • Other6%
What this section shows
  • New patients per month
  • Revenue from new vs. returning patients
  • New patients who started treatment
  • Top 10 paying patients
  • Patients by age and gender
  • Patients by governorate and job
  • Patient source and revenue per source
  • Patients per branch

Secretary: notes and recommendations

Reads the clinic's numbers every day and compares the last 30 days with the previous three months. Examples of what it says:

  • Dental implant cases are below the average.
  • Dermatology material use rose without a matching rise in sessions.
  • LASIK acceptance after the exam dropped this month.
What it watches
  • Completed procedures by type in each specialty, for the clinic and each doctor.
  • Treatment plan acceptance rate.
  • Stock consumption compared with workload.
  • New leads and the top reasons they did not continue.
  • Missed appointments.
And it suggests what to do, such as:
  • Follow up with patients who were offered a plan and haven't started.
  • A confirmation message a day and two hours before the visit to cut no-shows.
  • Review each room's consumption and make sure items are issued to patients.
  • Increase the budget of the best-performing ad.

Day report

A summary of everything that happened today, sent at closing time based on your permissions.

Per-specialty analytics

Revenue, expenses and balances for each specialty, with every treatment category.

Analytics button on every screen

Any list in the system becomes charts with one click.

Try it on your clinic

Leave your details and we'll show you the system and set up a trial for you.